These exercises have been provided by instructors from various institutions, to help students and researchers to learn the usage of MODIS data subsets.
Note to users: Please contact the professors before using their exercises in your class. If you create new classroom exercises or scripts that utlize the ORNL DAAC Terrestrial Ecology Subsetting & Visualization Services (TESViS) consider contributing to the list: email us.
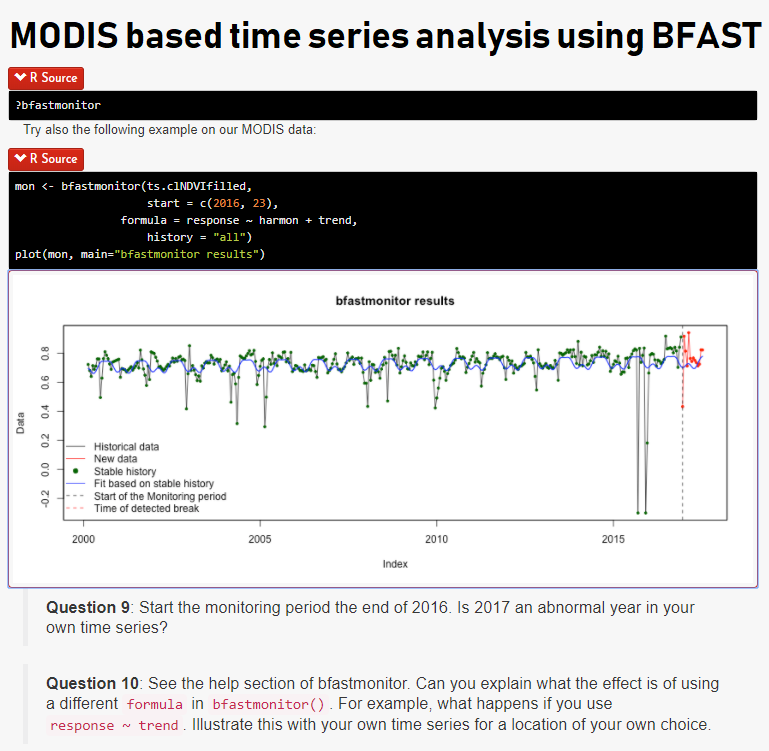
MODIS based time series analysis using BFAST
- Jan Verbesselt
- Associate Professor
- Laboratory of GIS and Remote Sensing
- Wageningen University
- The Netherlands
- Change Detection and Monitoring
This exercise is an introduction to MODIS NDVI time series analysis in R and implementation of the BFAST library for the decomposition of the time series into trend, season, and remainder components. This type of analysis is useful for detecting and characterizing change within the time series.
You will learn how to access MODIS NDVI fixed site data in CSV format, visualize the time series, perform quality filtering, and compute BFAST metrics within the R environment. This exercise is based on data for the Gelderland Loobos Site in The Netherlands.
Analysis of Vegetation Index
- May Myklebust
- Course Instructor
- Biology Department
- Trent University
- Peterborough, ON
- Trent University Biology
Scientists have access to more information today than ever before. The information comes in the form of research publications but also as research quality data. Often, these resources are free. We can therefore study just about anything we are interested in. The problem is knowing where to look and how the data may be used. The purpose of this lab is to expose you to research quality remotely sensed data.
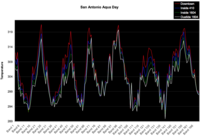
Remote Sensing in Hydrology
- Hongjie Xie
- Associate Professor
- Director of Remote Sensing and Geoinformatics Lab
- Department of Geological Sciences
- University of Texas at San Antonio
- UTSA LRSG
The purpose of this lab is to learn how to order, download, process, and analyze MODIS vegetation indices and compare it with in-situ soil moisture data.
Another exercise is included to learn how analyze MODIS LST products and to use them to examine the urban heat island phenomena for any one of the four cities: Houston, Dallas-Fort Worth, San Antonio, El Paso.
Quantitative Remote Sensing for Terrestrial Monitoring
- David Roy
- Senior Scientist, Professor of Geography
- Geographic Information Science Center of Excellence
- South Dakota State University
- Geospatial Sciences, SD State
This classroom exercise teaches quantitative remote sensing for terrestrial monitoring. You will learn how to (a) Extract the 16-day NDVI values from the M0D13A2 data, (b) Extract the 8-day MODIS Band 1 (red) and Band 2 (NIR) values from the MOD09A1 data and compute the NDVI from these values, and (c) Extract the 16-day MODIS Band 1 (red) and Band 2 (NIR) values from the MOD43B4 data and compute the NDVI from these values.
Remote Sensing Lab Exercise
- James T. Randerson
- Professor
- Department of Earth System Science
- University of California, Irvine
- Randerson Lab at UCI
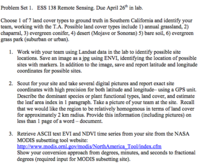
Learn to retrieve ASCII text EVI and NDVI time series for your site using MODIS subsetting tool from NASA's ORNL DAAC.
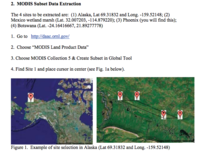
MODIS Subset Data Extraction and Visualization
- Alfredo Huete
- Professor
- Plant Functional Biology and Climate Change
- University of Technology, Sydney
- UTS Climate Change Cluster
The goals of this exercise are to (a) Understand some basic concepts in time series analysis with remote sensing, (b) Derive seasonal profiles of some land cover types, and (c) Derive some phenology metrics for various land cover types.
Geospatial Programming in Python
- David R. Maidment
- Professor
- Center for Research in Water Resources
- Department of Civil, Architectural and Environmental Engineering
- University of Texas, Austin
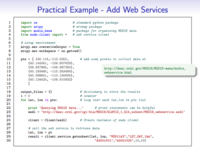
Learning objectives of this exercise are: (a) Understand the benefits of extending ArcGIS through programming, (b)Introduce Python programming basics, (c) Understand how to collect data using web services, and (d) Demonstrate how to build a Python script that uses ArcMap tools.
This page provides learning resources for using the ORNL DAAC's Terrestrial Ecology Subsetting & Visualization Services (TESViS) Subsets Tools. Additional resources are available at ORNL DAAC's resources page.
Webinar: Advancing Ecological Insights with NASA Subsetting and Visualization Tools and Services for Site-based Research
This webinar highlights the new datasets and tool capabilities and provide a Jupyter Notebook demonstration that shows how to enable the harmonization of remote sensing and in situ ecological data products with these tools and services.
Webinar: MODIS and VIIRS Data Tools and Services at your Fingertips
The first section of this webinar introduces the features and capabilities of three tools that provide access to user-specified subsets and visualizations of data from MODIS and VIIRS.
The second section of the webinar demonstrates how to integrate data delivered by the TESViS Web Service with user workflows as well as techniques for filtering the data based on custom data quality criteria. The workflows are demonstrated with R and Python in interactive Jupyter notebooks.
Tutorial: Access the MODIS web service and perform quality filtering using Python
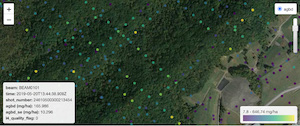
The tutorial outlined in the jupyter notebook will explore using the Python to access MODIS Land Products through the new REST web service hosted by the ORNL DAAC.
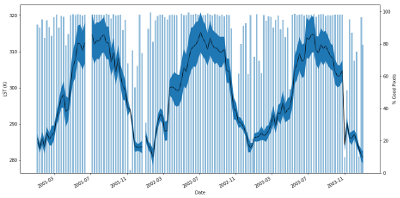
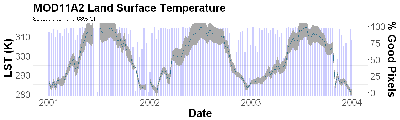
This tutorial will demonstrate how to do the following in Python: dates and subset request examples, build a time series of MOD11A2 land surface temperature from multiple web service subset requests, and perform quality control filtering based on multiple MODIS qc criteria
Tutorial: Access the MODIS web service and perform quality filtering using R
The tutorial outlined in the jupyter notebook will explore using the R to access MODIS Land Products through the new REST web service hosted by the ORNL DAAC.
This tutorial will demonstrate how to do the following in R: dates and subset request examples, build a time series of MOD11A2 land surface temperature from multiple web service subset requests, and perform quality control filtering based on multiple MODIS qc criteria
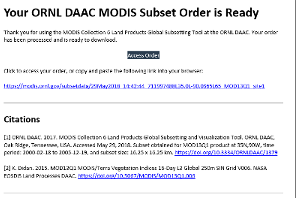
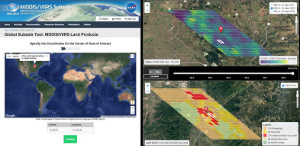
Tutorial: Submit a batch of MODIS Global Subset Tool orders via the MODIS Web Service
The tutorial demonstrates how to submit a batch of orders to the MODIS Global Subset Tool for a list of coordinates in a text file using the MODIS Web Services API maintained by the ORNL DAAC.
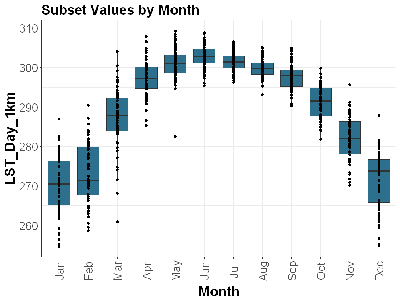
Tutorial: Plot Statistics Output from the MODIS Global and Fixed Site Tools
This document demonstrates how to generate informative plots from the statistics outputs of the MODIS Global Tool and MODIS Fixed Sites Tool maintained by the ORNL DAAC
This page provides links to community contributed tools and software add-ons that help download and processing of data using the ORNL DAAC's Terrestrial Ecology Subsetting & Visualization Services (TESViS). If you create new software packages or add-ons that utlize the ORNL DAAC Terrestrial Ecology Subsetting & Visualization Services (TESViS), consider contributing to this list: email us
MODISTools R Package
- Dr. Koen Hufkens
- Computational & Applied Vegetation Ecology Lab
- Ghent University
- Belgium
- Koen Hufkens
Programmatic interface to the 'MODIS Land Products Subsets' web services. Allows for easy downloads of 'MODIS' time series directly to your R workspace or your computer.
Tuck et al. (2014). MODISTools - downloading and processing MODIS remotely sensed data in R. Ecology & Evolution, 4(24), 4658 - 4668.
Python Client
- Dr. Tristan Quaife
- Department of Meteorology
- University of Reading
- UK
- Tristan Quaife
Python interface to the ORNL REST web service for MODIS and VIIRS-NPP data, and a basic class for handling small amounts of satellite data