The goal of the Terrestrial Ecology Subsetting & Visualization Services (TESViS) is to provide summaries of selected data products for the community to use for validation of models and remote-sensing products and to characterize field sites.
You may download MODIS Sinusoidal Grid (KMZ) or get more information about the formats and subsets offered by clicking the tabs below.
MODIS Land Subset Products Offered
Detailed information about file naming conventions, QC information, and file formats is provided in the product links. MODIS Land Products are provided by the Land Processes DAAC.
Service Availability: Web Service Fixed Sites Subsets Tool Global Subsets Tool
| Product | Acronym | Name | Collection | Frequency (Days) | Resolution (Meter) | Temporal Extent |
|---|
VIIRS Land Subset Products Offered
Detailed information about file naming conventions, QC information, and file formats is provided in the product links. VIIRS Land products are provided by the Land Processes DAAC.
Service Availability: Web Service Fixed Sites Subsets Tool Global Subsets Tool
| Product | Acronym | Name | Collection | Frequency (Days) | Resolution (Meter) | Temporal Extent |
|---|
Daymet Subset Products
Detailed information about file naming conventions, QC information, and file formats is provided in the product links. Daymet data is processed and distributed by the ORNL DAAC.
Service Availability: Web Service Fixed Sites Subsets Tool Global Subsets Tool
| Product | Acronym | Name | Version | Frequency | Resolution (Meter) | Temporal Extent |
|---|
SMAP Subset Products
Detailed information about file naming conventions, QC information, and file formats is provided in the product links. SMAP products are provided by the NSIDC DAAC.
Service Availability: Web Service Fixed Sites Subsets Tool Global Subsets Tool
| Product | Acronym | Name | Version | Frequency | Resolution (Meter) | Temporal Extent |
|---|
ECOSTRESS Subset Products
Detailed information about file naming conventions, QC information, and file formats is provided in the product links. ECOSTRESS products are provided by the LP DAAC.
Service Availability: Web Service Fixed Sites Subsets Tool Global Subsets Tool
| Product | Acronym | Name | Version | Frequency | Resolution (Meter) | Temporal Extent |
|---|
GEDI Subset Products
Detailed information about file naming conventions, QC information, and file formats is provided in the product links. GEDI products are provided by the ORNL DAAC.
Service Availability: Web Service Fixed Sites Subsets Tool Global Subsets Tool
| Product | Acronym | Name | Version | Frequency | Resolution (Meter) | Temporal Extent |
|---|
SIF Subset Products
The Solar Induced Fluorescence (SIF) products are part of a global, observation-based Earth System Data Record (ESDR) for quantifying global vegetation solar induced fluorescence (SIF) and photosynthesis gross primary productivity (GPP). SIF products are provided by the ORNL DAAC.
Service Availability: Web Service Fixed Sites Subsets Tool Global Subsets Tool
| Product | Acronym | Name | Version | Frequency | Resolution (Degree) | Temporal Extent |
|---|
ATLAS/ICESat-2 Subset Products
Detailed information about file naming conventions, QC information, and file formats is provided in the product links. Data products from Advanced Topographic Laser Altimeter System (ATLAS) instrument aboard the Ice, Cloud and land Elevation Satellite-2 (ICESat-2) are provided by the NSIDC DAAC.
Service Availability: Web Service Fixed Sites Subsets Tool Global Subsets Tool
| Product | Acronym | Name | Version | Frequency | Resolution | Temporal Extent |
|---|
Tabular Data Format
Format and example data values for [PRODUCT], [BAND], filtered_scaled, and land cover .csv files provided with the subset order.
| Column number | Example values | Description |
|---|---|---|
| 1 | MOD13Q1.A2000049.h11v05.006.2015136104550.250m_16_days_NDVI MOD13Q1.A2000049.h11v05.006.2015136104550.250m_16_days_EVI |
Unique row identifier |
| 2 | MOD13Q1 | Product Code |
| 3 | A2000049 | Acquisition Date [ A (YYYYDDD) ] |
| 4 | Lat35.9625Lon-85.35051Samp7Line7 | User selected center point coordinates and specified width (Samp) and height (Line) of bounding rectangle in pixels. Width x height denotes number of product values starting in Column 7. (e.g., 7 x 7 =49) |
| 5 | 2015136104550 | File Processing Date (YYYYDDDHHMMSS) |
| 6 | 250m_16_days_NDVI 250m_16_days_EVI |
Product Scientific Data Set (Band): Indicates type of values to follow. Specific values vary by product. |
| 7 to n | NDVI Example [BAND].csv: 4690,4780,4802,4364, … to n filtered_scaled_[BAND].csv: 0.469,0.478,F,0.4364, … to n |
* Data values of type as specified. Number of data columns as given in Column 4. |
| * Value "F" indicates a filtered pixel due to failed QC criteria or land cover masking | ||
Product file
Time series for all bands of the requested product are provided in one file. These data are the starting point for deriving the other subset data products. The [PRODUCT].csv file is formatted according to Table 1.
| Filename | Example |
|---|---|
| [PRODUCT].csv | MOD13Q1.csv |
Bands
Time series for each band are split into a separate file, called [BAND].csv, for each band. The [BAND].csv file is formatted according to Table 1.
| Filename | Examples |
|---|---|
| [BAND].csv | 250m_16_days_NDVI.csv 250m_16_days_EVI.csv |
Filtered and Scaled Data
Time series for data are provided for science data bands with a scale factor and QC filters applied. Pixels that fail QC criteria are set to "F". Pixels corresponding to land cover different than that of the subset center are set to "F" for files named "*_landcovermask.csv". The filtered_scaled files are formatted according to Table 1.
| Filename | Example |
|---|---|
| filtered_scaled_[BAND].csv | filtered_scaled_250m_16_days_NDVI.csv |
| filtered_scaled_[BAND]_landcovermask.csv | filtered_scaled_250m_16_days_NDVI_landcovermask.csv |
Land Cover Subsets
Four .csv files containing land cover data from the MCD12Q1 Land Cover Type 1 (IGBP) product are provided with each subset order. Land cover data are formatted following Table 1.
| Filename | Description |
|---|---|
| 12q1.csv | Land cover from 2013 for subset area |
| 12q1_201x201.csv | Land cover from 2013 for a 201 x 201 km region centered on the user-defined subset center |
| 12q1_[1km,500m,250m].csv | Land cover from 12q1.csv resampled to match the spatial resolution of the user-requested product. |
| 12q2.csv | MCD12Q2 Land Cover Dynamics timeseries product providing vegetation phenology parameters |
Phenology
Phenology files are provided with each order. Data are presented, in tabular format, for average day of greenness increase, maximum, decrease, and minimum for the subset area for each detected phenology cycle derived from MCD12Q2. Phenology files may contain up to two cycles per year.
| Filename | Description |
|---|---|
| Phenology.csv | Average day by day of year |
| Phenology_CalendarDates.csv | Average day by calendar date |
Contents of the phenology .csv files are formatted according to Table 2.
| Column header | Description | Example value Phenology.csv |
Example value Phenology_CalendarDates.csv |
|---|---|---|---|
| Year | year of row | 2001 | 2001 |
| Cycle | full vegetation cycles (maximum of 2) | Cycle 1 | Cycle 1 |
| Increase | mean day of greenness increase | 76 | Mar 17 |
| Maximum | mean day of greenness maximum | 137 | May 19 |
| Decrease | mean day of greenness decrease | 195 | Jul 21 |
| Minimum | mean day of greenness minimum | 308.5 | Nov 14 |
Statistical Summary of Subset Area
Statistical summaries of the data for each step in the time series for science data bands are provided with the subset order. Pixels corresponding to land cover different than that of the subset center are set to "F" for files named "*_landcovermask.csv". Two .csv files are provided per science data band.
| Filename | Example |
|---|---|
| statistics_[BAND].csv | statistics_250m_16_days_NDVI.csv |
| statistics_[BAND]_landcovermask.csv | statistics_250m_16_days_NDVI_landcovermask.csv |
Contents of the statistics .csv files are formatted according to Table 3.
| Column number | Column heading | Description |
|---|---|---|
| 1 | date[YYYYDDD] | Acquisition date. Four-digit year and three-digit day of the year |
| 2 | date | Acquisition calendar date: YYYY-MM-DD |
| 3 | product | Selected Product |
| 4 | band | Scientific Data Set. Refers to a specific wavelength range measured by the sensor (Band1, 620-670 nm) or to a specific product derived from several measured bands (MOD15A2: Lai_500m and Fpar_500m; MOD09A1: sur_refl_b01, sur_refl_b02, etc.) or a data variable. |
| 5 | min | Minimum value of pixels within the subset area |
| 6 | max | Maximum value of pixels within the subset area |
| 7 | sum | Sum of pixels within the subset area |
| 8 | range | Range of pixels within the subset area |
| 9 | mean | Mean value of pixels within the subset area |
| 10 | variance | Variance of pixels within the subset area |
| 11 | standard_deviation | Standard deviation of pixels within the subset area |
| Columns 12-14 for statistics_[BAND].csv | ||
| 12 | tot_pixels | Total number of pixels in the requested area |
| 13 | pixels_pass_qa | Number of pixels in the requested area passing quality filters |
| 14 | per_cent_pixels_pass_qa | (Number of pixels with acceptable quality in the requested area / total number of pixels) * 100 |
| Columns 12-14 for statistics_[BAND]_landcovermask.csv | ||
| 12 | tot_pixels | Total number of pixels in the requested area having the same land cover class as the center pixel |
| 13 | pixels_pass_qa | Number of pixels in the requested area having the same land cover class as the center pixel and passing quality filters |
| 14 | per_cent_pixels_pass_qa | (Number of pixels with the same land cover as the center pixel and acceptable quality in the requested area / total number of pixels having the same land cover class as the center pixel) * 100 |
R Code and Graphics
An R script is provided for each science data band for generating the plots (also provided as .png images) listed in Table 4. R plots are concatenated in a single .pdf file available on the .csv Data page and can be previewed by choosing the "R Code and Graphics" tab at the bottom of the order visualization page.
| Filename | Description |
|---|---|
| R_script[BAND].R | R scripts for generating plots for each science band |
| R_MODIS_Plots_[BAND]_Fig1_timeseries.png | Plot of subset mean values and variation over time |
| R_MODIS_Plots_[BAND]_Fig2_timeseries.png | Plot of subset mean values summarized by month |
| R_MODIS_Plots_[BAND]_Fig3_timeseries.png | Plot of subset mean values summarized by year |
| R_MODIS_Plots_[BAND]_Fig4_timeseries.png | Frequency histogram plot of all subset area mean values |
| R_MODIS_Plots_[BAND]_Fig5_timeseries.png | Time series plot with years stacked and a loess smoothed fit curve for each year |
| R_MODIS_Plots_[BAND]_Fig6_timeseries.png | Plot subset area mean grouped by year and month |
GeoTIFF Data
Product GeoTIFF Data and Landcover GeoTIFF Data download links provide compressed tar archive files (GTiff.tar.gz and GTiff_mcd12q.tar.gz) containing subset geotiffs.
GTiff.tar.gz
Provides one geotiff per band for each date in the time series generated from the rows in [PRODUCT].csv. Files are named as follows:
| Filename | Example |
|---|---|
| [Source MODIS filename]_[BAND].tif | MOD13Q1.A2000049.h11v05.006.2015136104550_250m_16_days_NDVI.tif |
GTiff_mcd12q.tar.gz
Provides a geotiff for the MCD12Q1 Land Cover Type 1 (IGBP) product from 2013 named as follows:
| Filename | Example |
|---|---|
| [Source MODIS filename]_Land_Cover_Type_1.tif | MCD12Q1.A2013001.h17v02.005.2011085002532_Land_Cover_Type_1.tif |
Citation Files
Citations are provided to allow this specific subset order to be referenced in a publication. Filenames are citation.bib and citation.txt
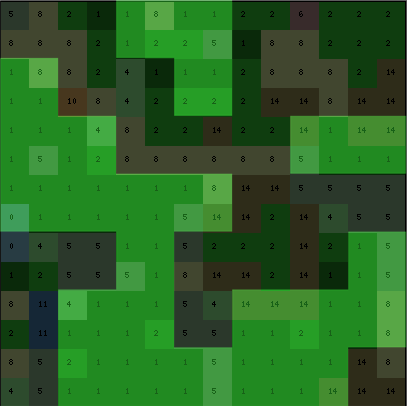
Aggregate 500m Land Cover (MCD12Q1) to 1km
For the Global subsetting tool, we provide two summaries of data: one is a summary for all pixels in the selected area and the other is the summary for all pixels with the same land cover class as the center pixel (the pixel that contains the field site or flux tower).
The land cover (MCD12Q1) is available at 500m. To obtain a summary of pixels in the selected area with the same land cover class at 1km resolution, the 500m pixels are aggregated to 1km pixels. Below is an image showing the 500m land cover for a 7 x 7 km subset region. The example subset region has a center pixel of "(1) Evergreen Needleef Forest".
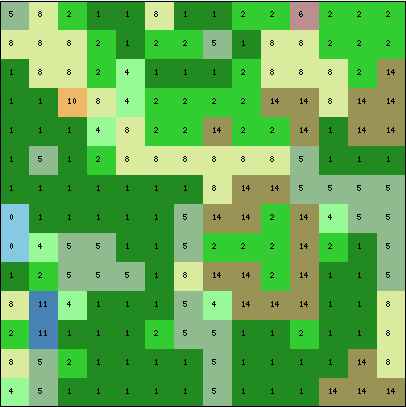
The aggregation from 500m to 1km pixel is done by identifying 1km pixels that have 2 or more 500m pixels having the same land cover class as the 1km center pixel. Below is a 1km landcover image showing the aggregation. The black pixels cells are pixels that did not satisfy the aggregation criteria.

Below is a composite image showing the 500m landcover pixels with the aggregated 1-km pixels. The darker regions are 1km pixels that did not satisfy the aggregation criteria.
Method Used to Calculate Albedo from MCD43A1 (MODIS Albedo Model Parameter)
Albedo MCD43A
The ALBEDO data are based on the Terra and Aqua(Combined) MODIS BRDF / Albedo Model Parameter Product (MCD43A1). The primary BRDF model parameters from MCD43A1 are used in the following equations to calculate Black-sky, white-sky, and actual (blue-sky) albedo. We have used a solar zenith angle (szn) equal to local solar noon and an optical depth of 0.2 as default values in calculating these data files.
Black-sky Albedo = Parameters_01 + Parameters_02 * (-0.007574 + (-0.070987 * szn2) + (0.307588 * szn3)) + Parameters_03 * (-1.284909 + (-0.166314 * szn2) + (0.041840 * szn3))
White-sky Albedo = Parameters_01 + Parameters_02 * (0.189184) + Parameters_03 * (-1.377622)
Blue-sky (Actual) Albedo = White-sky Albedo * f(optical depth, solar zenith angle, aerosol type, band) + Black-sky Albedo * (1 - f(optical depth, solar zenith angle, aerosol type, band))
where
Parameters_01 corresponds to the MCD43A1 band "BRDF_Albedo_Parameters_nn.Num_Parameters_01",
Parameters_02 corresponds to the MCD43A1 band "BRDF_Albedo_Parameters_nn.Num_Parameters_02",
Parameters_03 corresponds to the MCD43A1 band "BRDF_Albedo_Parameters_nn.Num_Parameters_03"
for nn=vis (Band_08 Visible Broadband), nn=nir (Band_09 Near Infrared Broadand) and nn=shortwave (Band_10 Shortwave Broadband)
Additional information can be found on the LP DAAC web site and at the BRDF Science Team web site.
The Fixed Sites Subsets Tool provides customized subsets and visualizations of several terrestrial ecology data products for selected field and flux tower sites around the world. Spatial subsets of the land products are available for predefined areas of about 8x8-km centered on the selected sites. The site-specific data can be downloaded in both comma separated value (*.csv) and JSON formats. The data are in the native projection system. Please email us to submit your sites.
Access using the Network IDs
The Fixed Sites Tool uses its own unique IDs for its 2000+ sites. Most networks (such as FLUXNET, NEON, etc) use their own unique IDs for their sites. For some networks, the data and visualization from the Fixed Sites Tool can be accessed directly using the network IDs. Here is how:
To list all the available sites in a network, go to the following URL:
Examples:https://modis.ornl.gov/sites/?list=all&network={network}
https://modis.ornl.gov/sites/?list=all&network=NEON
https://modis.ornl.gov/sites/?list=all&network=FLUXNETTo access a fixed site page using the network ID, go to the following URL:
Examples:https://modis.ornl.gov/sites/?network={network}&network_siteid={network_siteid}
https://modis.ornl.gov/sites/?network=NEON&network_siteid=CPER
https://modis.ornl.gov/sites/?network=FLUXNET&network_siteid=US-TonTo access a product subset using the network ID, go to the following URL:
Examples:https://modis.ornl.gov/cgi-bin/sites/site/?network={network}&network_siteid={network_siteid}&product={product}
https://modis.ornl.gov/cgi-bin/sites/site/?network=NEON&network_siteid=CPER&product=MCD15A2H
https://modis.ornl.gov/cgi-bin/sites/site/?network=FLUXNET&network_siteid=US-Ton&product=VNP13A1
To access a product subset data for a network site using the Web Service , please send the GET request to:
Additional detail for the web service access is available at the REST API Documentation./api/v1/{product}/{network}/{network_siteid}/subset
Currently, this feature is available for the following networks:
Widget
If you are interested in displaying the timeseries visualization as a widget within your own website or application, the code to embed the widget is provided below. All you will need to do is modify the fourth line in the code below to reflect the parameters for your site and product, and insert the code into the body section of your web page where you want the widget to be displayed.
<div id="ornl_modis_ts" style="width:1000px;height:300px;"></div>
<script>
(function (w,d,s,o,f,js,fjs) {
  w['TimeseriesWidget']=o;w[o] = w[o] || function () { (w[o].q = w[o].q || []).push(arguments) };
  js = d.createElement(s), fjs = d.getElementsByTagName(s)[0];
  p = { network: 'AmeriFlux', network_siteid: 'US-Ton', product: 'MOD13Q1', band: '250m_16_days_NDVI' };// REQUIRED PARAMETERS (examples here for AmeriFlux site 'US-Ton' and MOD13Q1 NDVI band!!!
  js.id = o; js.src = f+'?n='+p.network+'&i='+p.network_siteid+'&p='+p.product+'&b='+p.band;
  js.async = 1; fjs.parentNode.insertBefore(js, fjs);
}(window, document, 'script', 'fs', '//modis.ornl.gov/cgi-bin/sites/widget.pl'));
fs('visualize', 'timeseries');
</script>
Inactive Sites
A network site becomes inactive when it is decommissioned or stops collecting data for a considerable period of time. We will stop updating the sensor data (MODIS, VIIRS) for the inactive sites, and archive the data only for the period the site was operational. If you think a site should not be inactive, please email us.
Data Availability
Some data products are available only for selected sites.
Daymet: Subsets from Daymet are available only for the sites in continental North America (Mexico, United States, Canada), Hawaii, and Puerto Rico. Sites with subsets from Daymet are listed here: https://modis.ornl.gov/sites/?list=all&product=Daymet
ECOSTRESS: Subsets from ECOSTRESS products are available only for selected sites. Sites with subsets from ECOSTRESS products are listed here: https://modis.ornl.gov/sites/?list=all&product=ECOSTRESS
GEDI: Subsets from GEDI products are available only for the sites within a latitude extent of ~52° N to ~52° S. Sites with subsets from GEDI products are listed here: https://modis.ornl.gov/sites/?list=all&product=GEDI
MCD43A and MCD43A4: Subsets from MODIS products MCD43A and MCD43A4 are available only for selected sites. Sites with subsets from MCD43A and MCD43A4 products are listed here: https://modis.ornl.gov/sites/?list=all&product=MCD43A